The UK Fiscal Observatory: 2025/26
A comprehensive, interactive breakdown of how the government raises £1.23 trillion, where it spends £1.29 trillion, and who exactly carries the burden.
1. The Macro Picture: Understanding the Structural Deficit
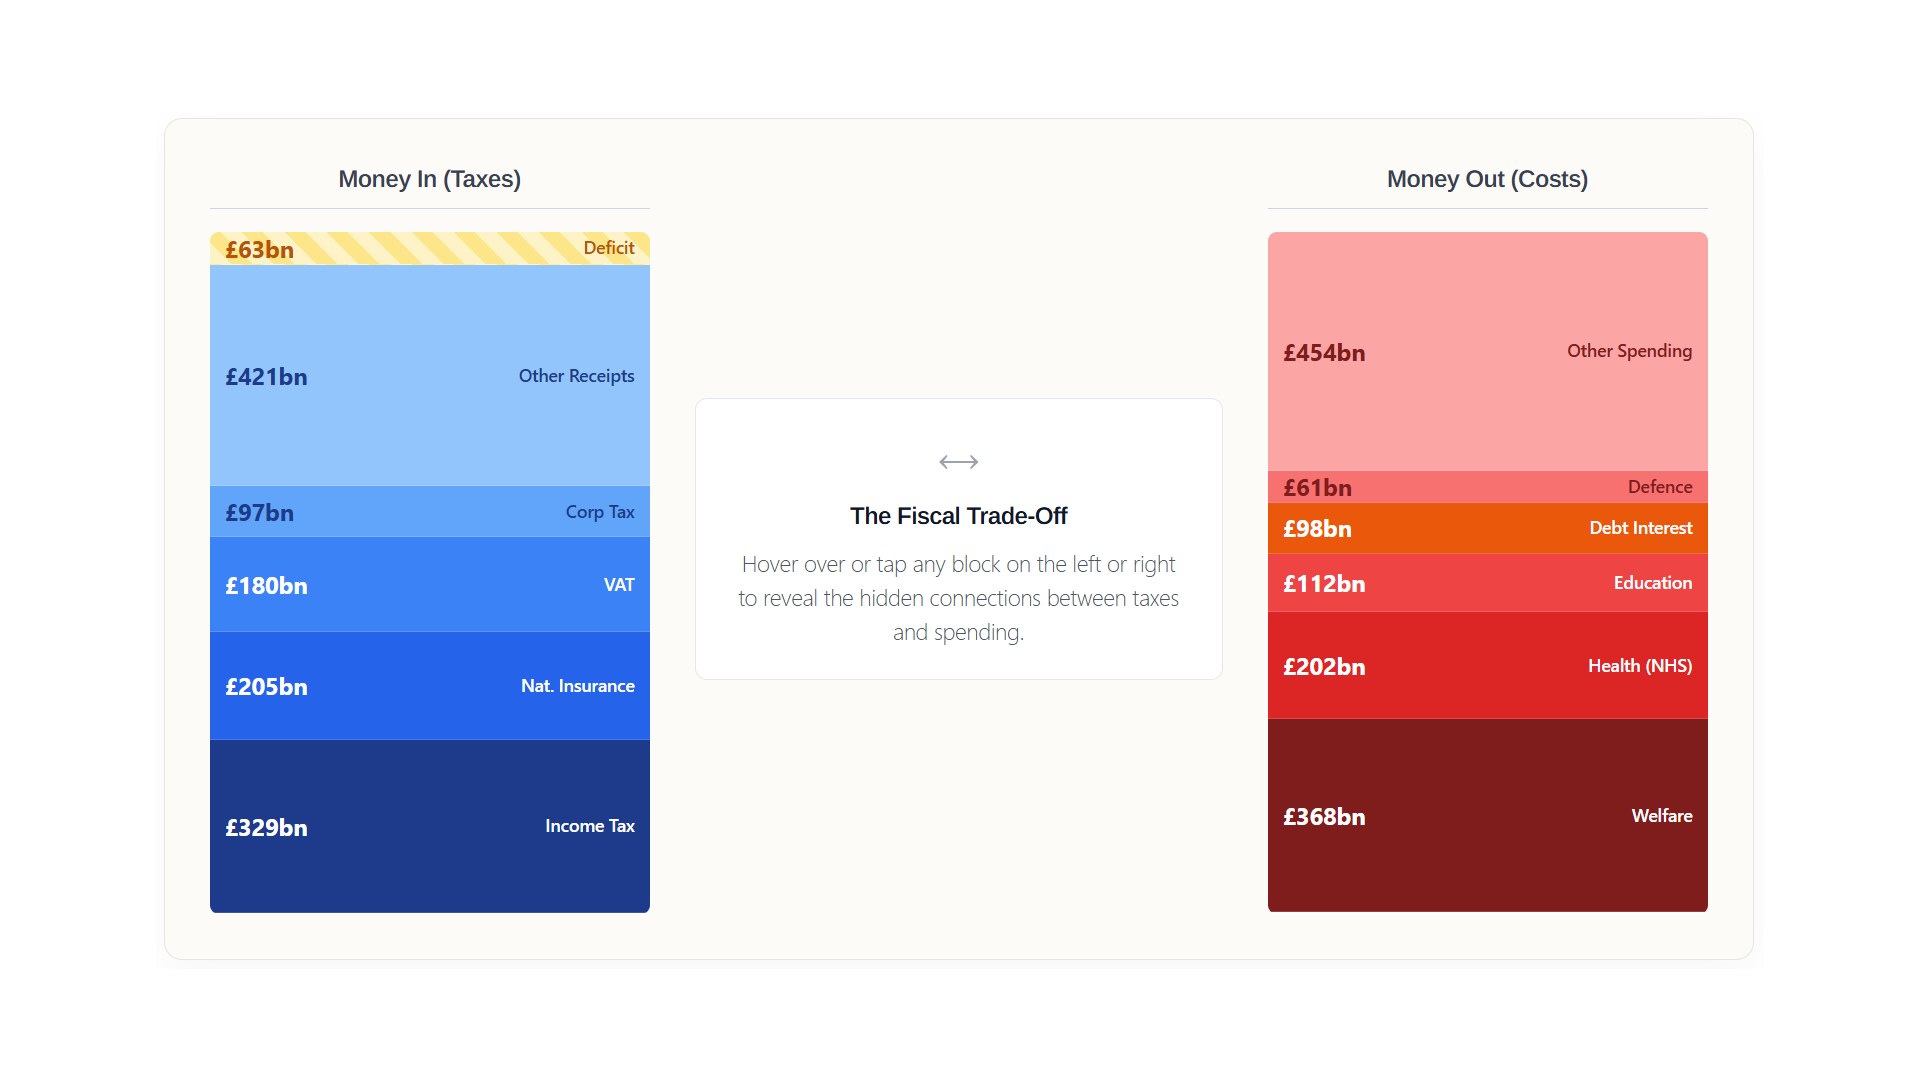
To understand the UK’s public finances, one must look at both sides of the ledger simultaneously. For the 2025/26 financial year, the Office for Budget Responsibility (OBR) forecasts that the government will collect £1,232 billion in taxes, but it plans to spend £1,295 billion. The difference leaves a shortfall of approximately £63 billion.
This gap represents a structural deficit. Hover over the allocator below to see exactly how these massive numbers trade off against one another.
Money In (Taxes)
The Fiscal Trade-Off
Hover over or tap any block on the left or right to reveal the hidden connections between taxes and spending.
Money Out (Costs)
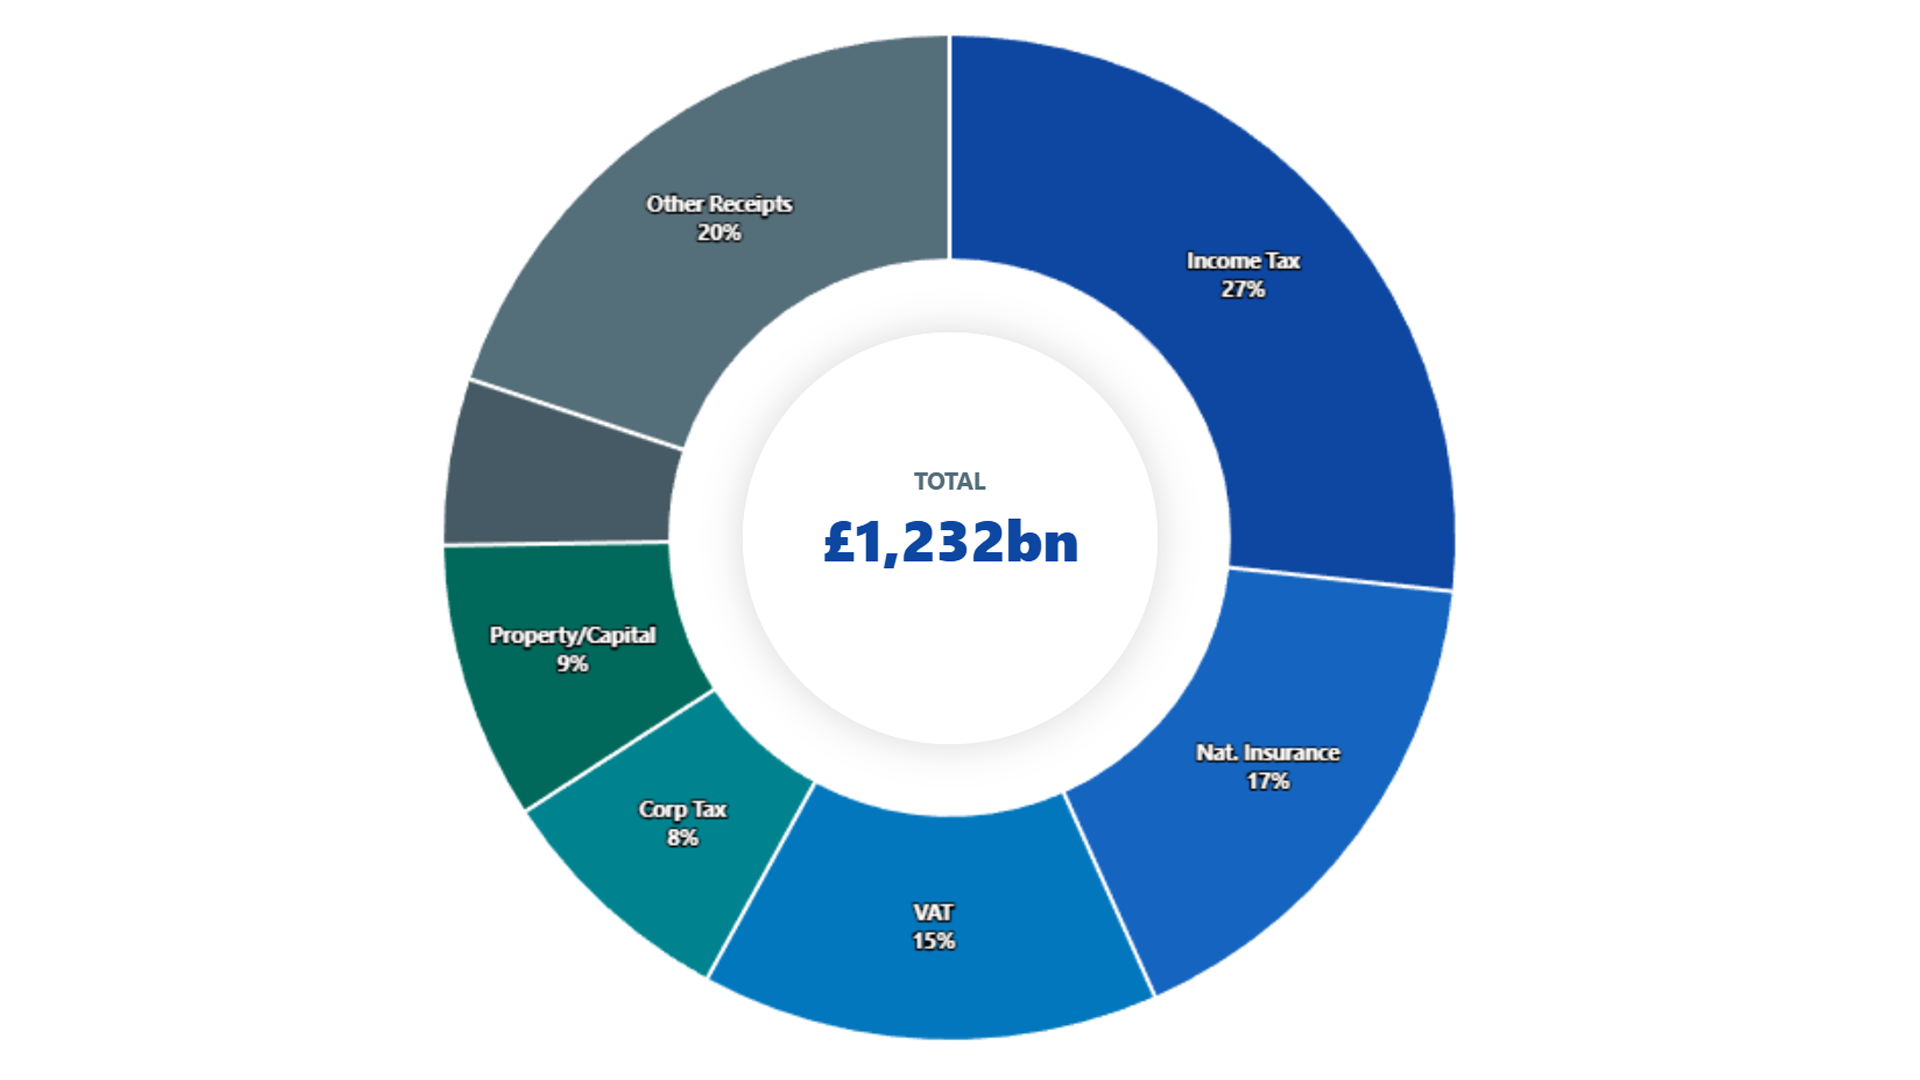
2. Money In: The Taxation Landscape
The interactive explorer below breaks down the £1.23 trillion revenue stream. Click on the main categories to drill down into the specific taxes that fund the state.
Total Revenue
Total forecasted receipts for the UK public sector.
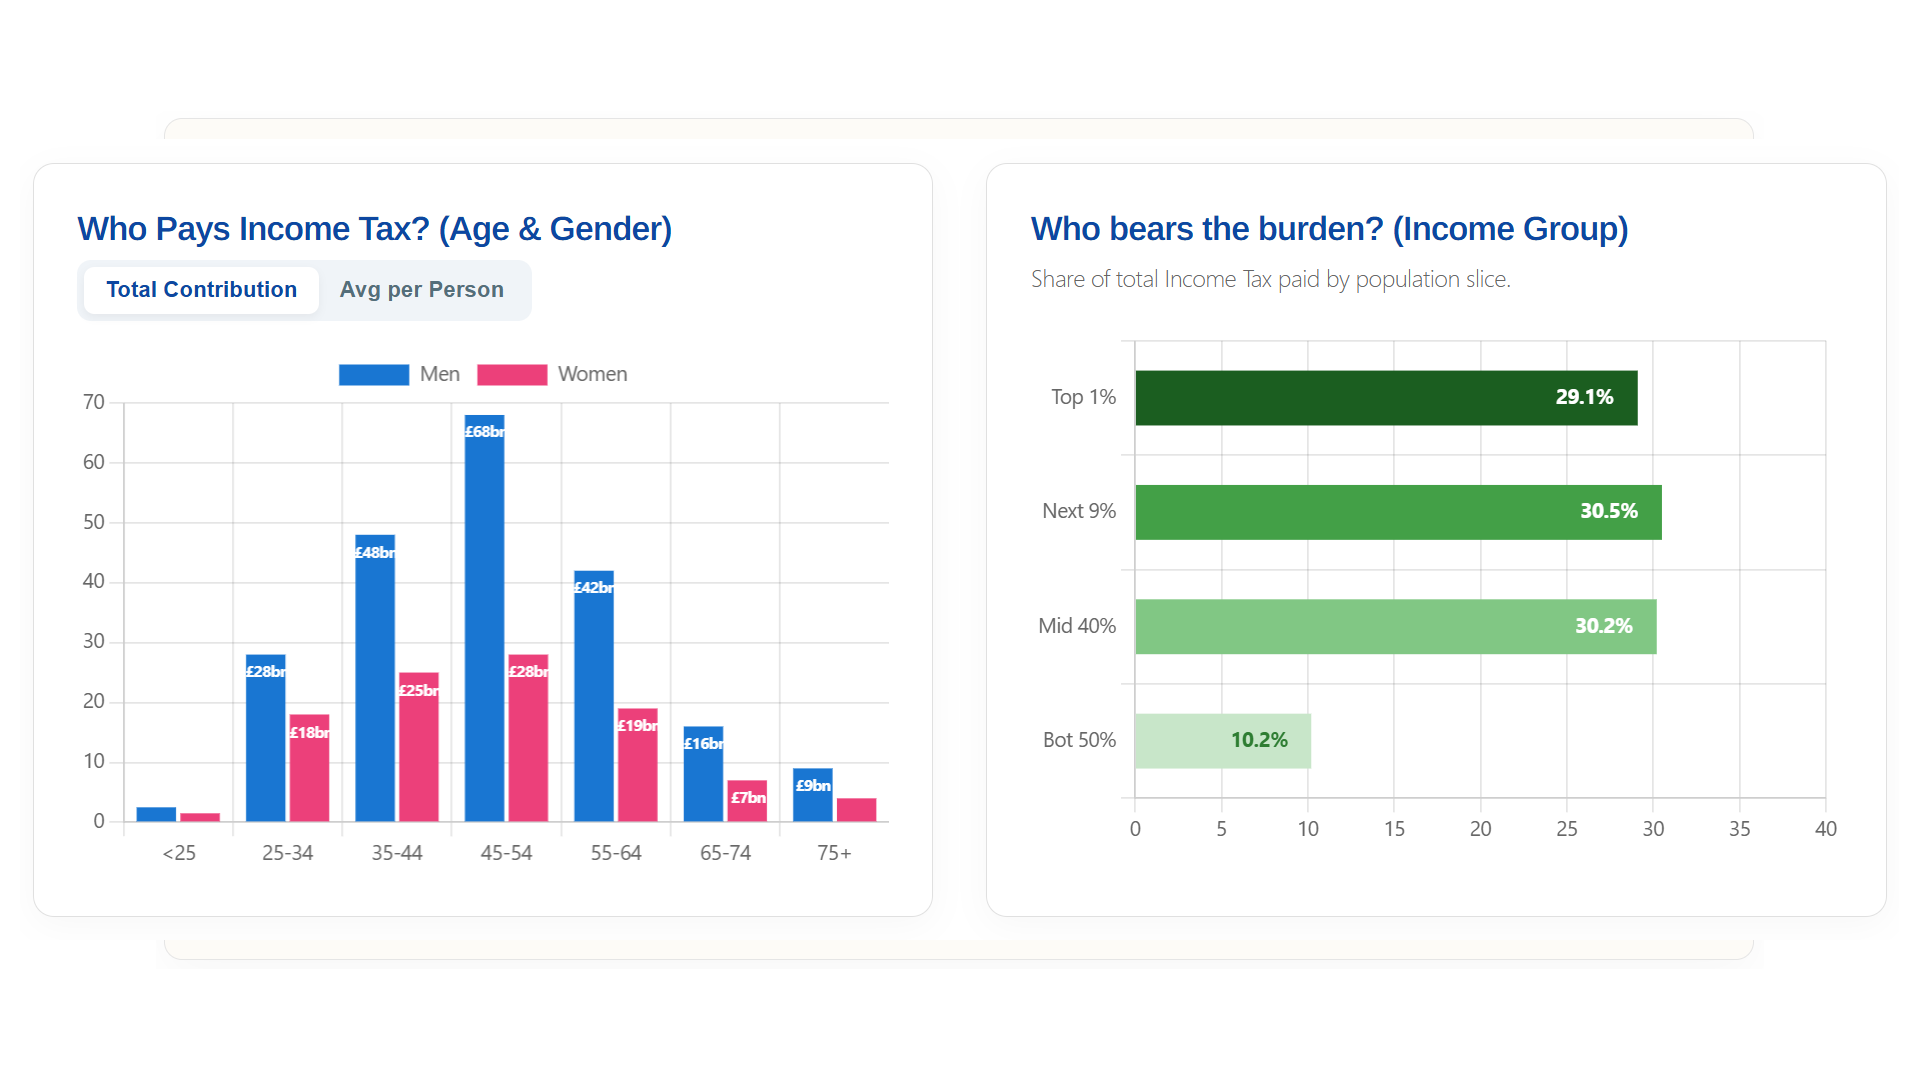
3. The Burden: Who Actually Pays?
Breaking down tax revenue by demographics reveals that public finances rely heavily on a surprisingly specific slice of the population.
Who Pays Income Tax? (Age & Gender)
Who bears the burden? (Income Group)
Share of total Income Tax paid by population slice.
The Progressive Peak vs. The Regressive Reality
The UK operates a highly “progressive” direct tax system: the top 10% of earners contribute a staggering 60% of the entire Income Tax bill. However, indirect taxes—like VAT and fuel duty—tell the opposite story.
The “Hidden” Tax Bill (VAT & Duties)
Indirect taxes paid by household income decile (Poorest to Richest).
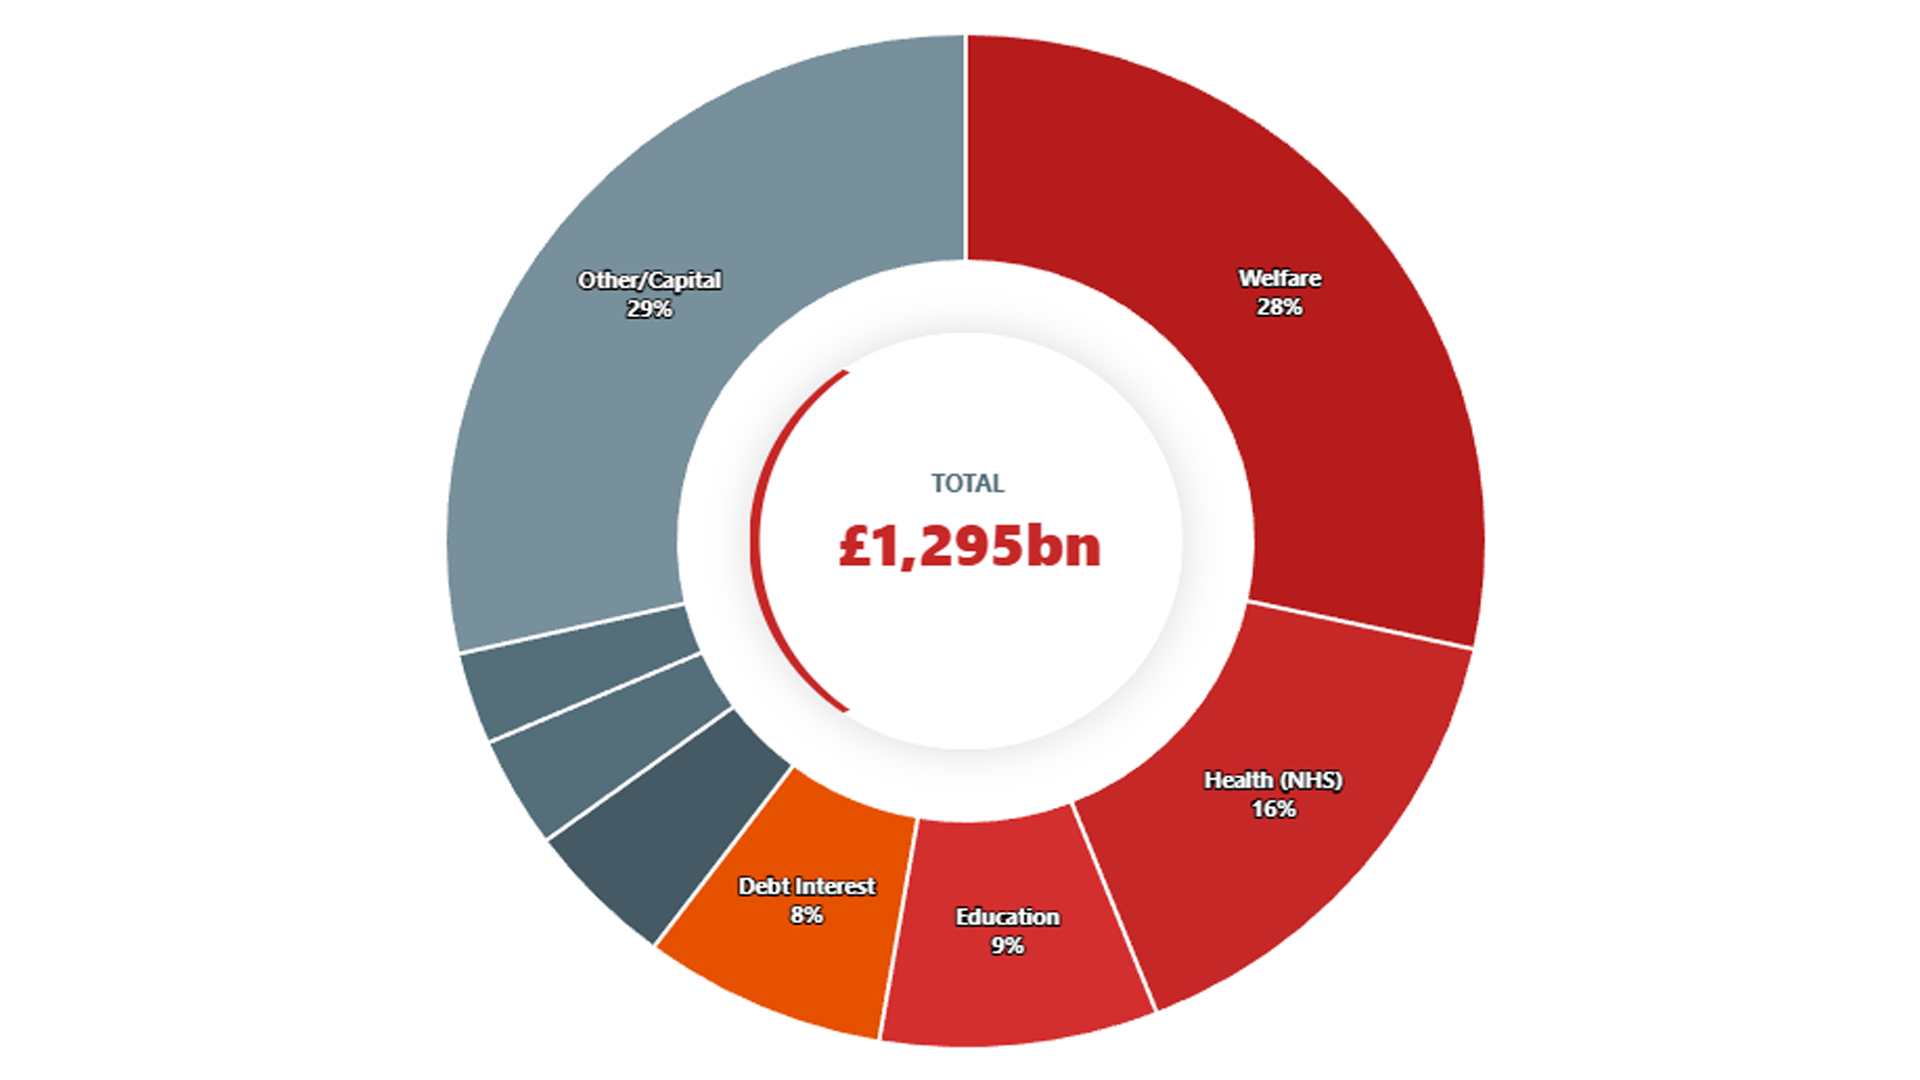
4. Money Out: Analyzing Government Expenditure
Explore the chart below to see the sheer scale of Welfare and NHS funding compared to “traditional” state functions like Defence, Transport, and the Justice system.
Total Spending
Total forecasted managed expenditure for the UK.