Author: admin

  • The £63 Billion Gap: Understanding the UK’s Structural Deficit

    The £63 Billion Gap: Understanding the UK’s Structural Deficit

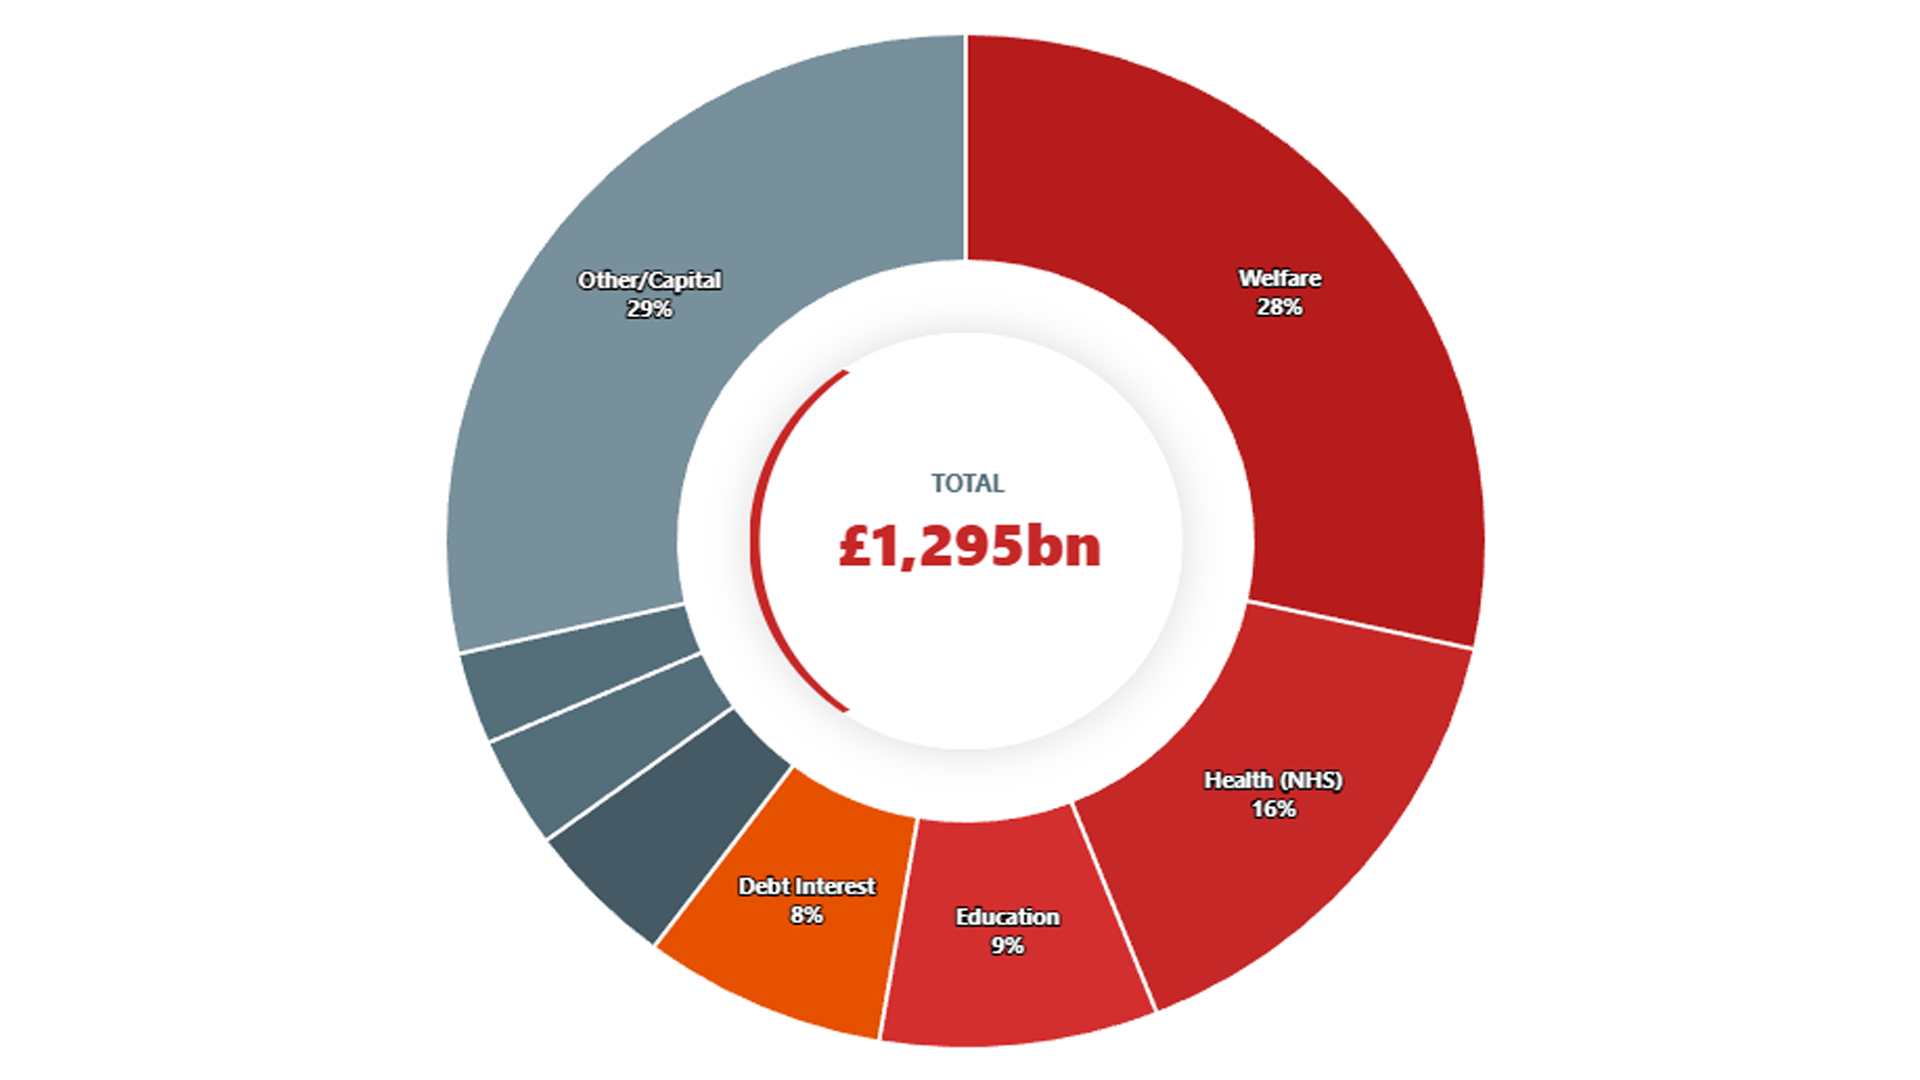
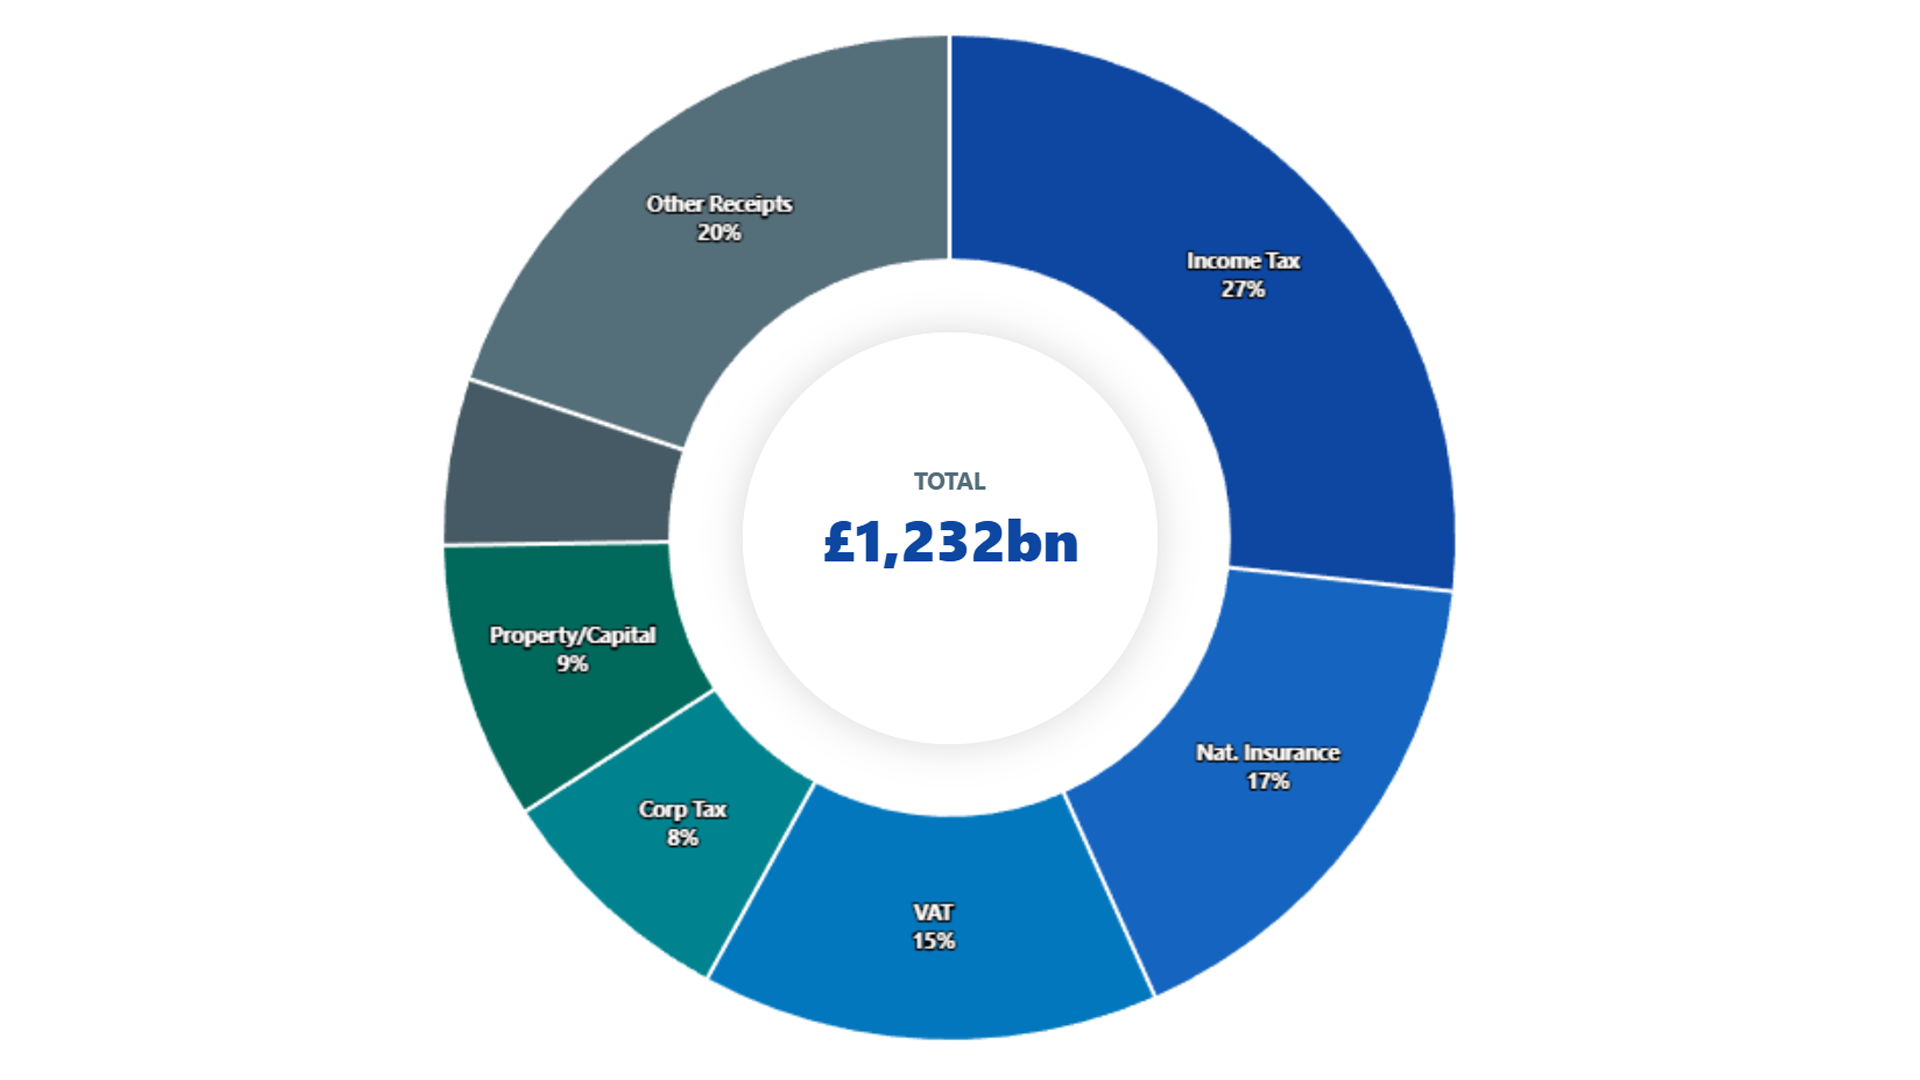
    To understand the UK’s public finances, one must look at both sides of the ledger simultaneously. For the 2025/26 financial year, the Office for Budget Responsibility (OBR) forecasts that the government will collect £1,232 billion in taxes and other receipts, but it plans to spend £1,295 billion.

    Interactive Tool

    The Fiscal Trade-Off

    Hover or tap any block below to see exactly what your taxes pay for—and what our national costs consume.

    Money In (Taxes)

    £63bn Deficit (Borrowing)
    £421bn Other Receipts
    £97bn Corp Tax
    £180bn VAT
    £205bn Nat. Insurance
    £329bn Income Tax

    Explore the Budget

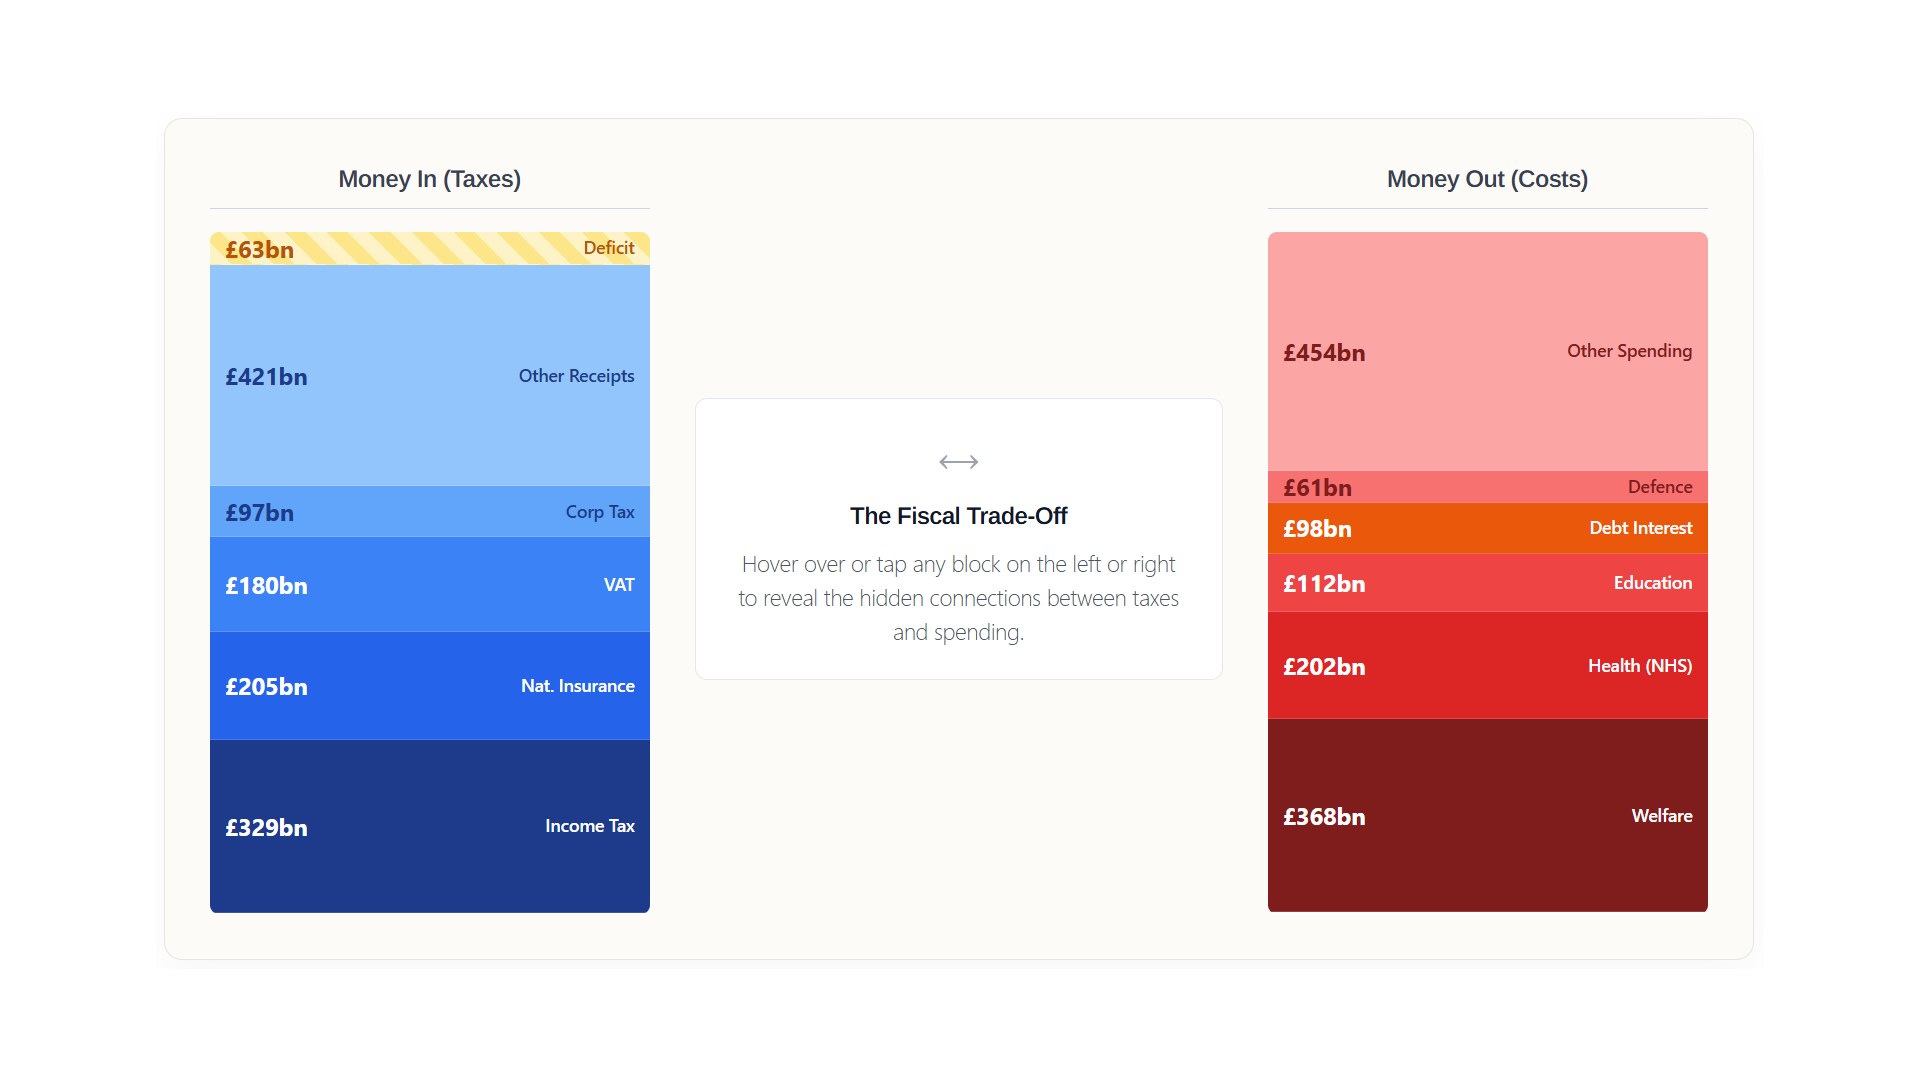
    Hover over or tap any block on the left or right to reveal the hidden connections between the taxes we pay and the public services they fund.

    Money Out (Costs)

    £454bn Other Spending
    £61bn Defence
    £98bn Debt Interest
    £112bn Education
    £202bn Health (NHS)
    £368bn Welfare & Pensions
    Data: OBR Economic and Fiscal Outlook, November 2025. Analysis represents conceptual burden equivalents.

    The difference between these two figures leaves a shortfall of approximately £63 billion.

    This gap is not an anomaly caused by a sudden economic shock like a pandemic or a financial crisis. Instead, it represents a structural deficit—a persistent imbalance between what the modern UK state is mandated to provide and what the current tax system is capable of raising.

    By putting the receipts and spending data side-by-side, the underlying mechanics of this £63 billion shortfall become clear. It is the result of a “revenue ceiling” meeting an “expenditure floor.”

    The Revenue Ceiling: A Concentrated Tax Base

    The UK tax system is highly effective at raising capital, with the overall tax burden forecast to reach a post-war high of roughly 38.3% of GDP. However, the data reveals that this revenue relies heavily on a narrow demographic foundation.

    • Heavy Reliance on Income Taxes: Income Tax and National Insurance combined account for over £530 billion—nearly 45% of all government revenue.
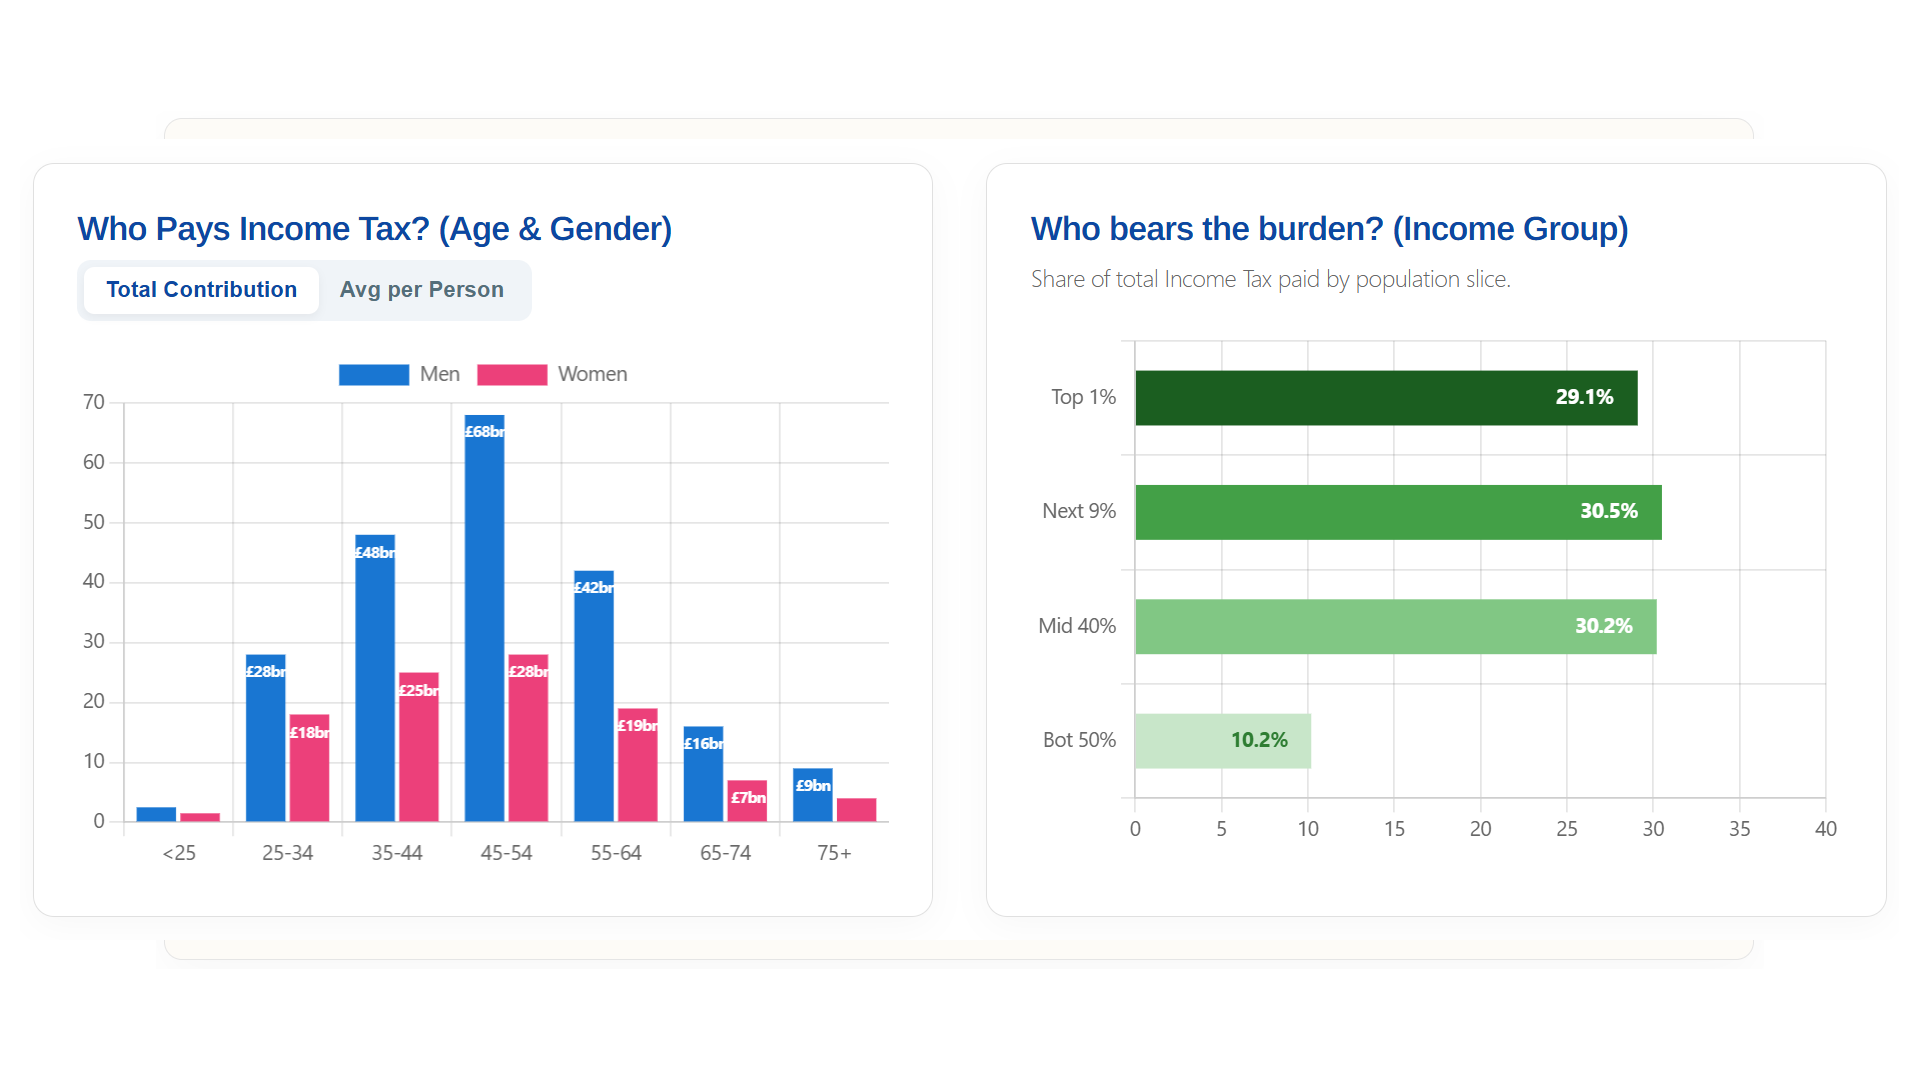
    • A Top-Heavy System: As demographic data shows, the vast majority of this revenue is generated by a small percentage of high-earning, working-age individuals. The top 10% of earners contribute roughly 60% of all Income Tax.

    This concentration creates a “revenue ceiling.” Governments face significant political and economic friction when attempting to raise taxes further on this small group of high earners. Conversely, attempting to broaden the tax base by raising taxes on the lower-earning majority—either through basic rate Income Tax hikes or increasing indirect taxes like VAT—carries heavy political risks and disproportionately impacts the cost of living for poorer households.

    The expenditure floor: The cost of demographics

    While revenue generation is constrained, public spending is subject to relentless upward pressure, creating a rigid “expenditure floor.”

    • The Dominance of Health and Welfare: Combined, Welfare & Pensions (£368bn) and Health (£202bn) consume roughly 44% of total public spending. Unlike capital investments (such as building roads or railways), these are day-to-day statutory obligations.
    • The Aging Population: Both of these massive budgets are intrinsically linked to demographics. An aging population guarantees year-on-year increases in State Pension costs (further amplified by the “Triple Lock”) and structurally higher demand for NHS and social care services. These costs rise independently of economic growth.

    The compounding cost: Debt interest

    When the expenditure floor exceeds the revenue ceiling, the government must borrow money from financial markets by issuing government bonds (gilts) to fund the £63 billion difference.

    This borrowing is where the structural deficit becomes a compounding issue.

    Because the UK has run a deficit for most of the last two decades, it has accumulated a substantial national debt. Servicing this debt is now one of the largest single line items in the budget. At £98 billion for 2025/26, debt interest payments are significantly larger than the entire Defence or Public Order budgets, and nearly equal to the Education budget.

    Crucially, this £98 billion does not buy new hospitals, fund schools, or build infrastructure—it merely services past borrowing. When a government must borrow just to pay the interest on previous borrowing, fiscal flexibility is severely limited.

    The Fiscal Trilemma

    The £63 billion gap between the £1,232bn coming in and the £1,295bn going out illustrates a fundamental fiscal trilemma facing policymakers. To close a structural deficit, a government ultimately has only three levers to pull:

    1. Raise Taxes: Further increase the tax burden on a historically highly-taxed population, risking economic stagnation or capital flight.
    2. Cut Spending: Reduce the scope of the state, which is politically difficult given the aging population and existing pressures on the NHS and welfare system.
    3. Accept the Deficit: Continue borrowing to bridge the gap, accepting that a growing share of future tax revenue will be diverted away from public services to pay debt interest.

    Without sustained, rapid economic growth to organically boost tax receipts without raising tax rates, the UK’s public finances will remain a delicate balancing act between these three difficult choices.

  • How Does the UK Government Spend Your Tax?

    How Does the UK Government Spend Your Tax?

    UK Public Sector Spending (2025/26 Forecast)

    TOTAL
    £1,295bn
    Click to Reset

    Total Spending

    Forecast (2025/26) £1,295 Billion
    Cost Per Household £45,280

    Total forecasted managed expenditure for the UK public sector (2025-26).

    💡
    OBR Key Insight
    Total spending remains at historically high levels (approx. 44% of GDP), driven by an ageing population and higher debt servicing costs.
    Source: OBR Economic and Fiscal Outlook (Table 4.3 – Total Managed Expenditure).

    For the 2025/26 financial year, Total Managed Expenditure (TME) for the UK public sector is forecast to reach £1,295 billion. To put this macro-economic figure into perspective, it equates to approximately £45,280 being spent for every household in the country.

    Total spending currently sits at historically high levels – roughly 44% of GDP – driven by long-term demographic shifts, post-pandemic economic realities, and the rising cost of servicing national debt.

    By breaking down the budget, we can observe that the vast majority of government revenue is consumed by a few core areas, leaving a relatively small envelope for all other state functions.

    The “big two”: welfare and health

    The modern UK state is primarily a mechanism for social protection and healthcare. Together, these two areas account for nearly half of all government spending.

    • Welfare & Pensions (£368 Billion): This is by far the largest single block of public expenditure. The primary driver is the State Pension (£148bn), which continues to grow due to an aging demographic and the “Triple Lock” policy guaranteeing annual increases. Additionally, spending on working-age benefits, particularly disability and incapacity benefits (£45bn), has seen a sharp, structural upward trend since 2020.
    • Health (£202 Billion): Healthcare spending has grown faster than the wider economy for decades. The core NHS England budget (£168bn) absorbs over 40% of all day-to-day departmental spending across Whitehall. This budget is under continuous pressure from an aging population, the rising cost of medical technology, and the need to address treatment backlogs.

    The cost of borrowing: debt interest

    Perhaps the most significant shift in the UK’s fiscal landscape over the past five years is the cost of servicing the national debt.

    • Debt Interest (£98 Billion): Following a period of record-low interest rates in the 2010s, the cost of government borrowing has surged. At £98 billion, debt interest is now the fourth-largest area of public spending. It is significantly larger than the entire Defence budget and nearly eclipses the total budget for Education. This represents a fixed cost that cannot be actively managed down without paying off the underlying debt, effectively limiting the funds available for public services or tax cuts.

    Education and core state functions

    Beyond welfare, health, and debt, the remaining budget must cover all other functions expected of a modern state.

    • Education (£112 Billion): The third-largest spending area covers everything from early years childcare to university funding. While spending per pupil in schools is being maintained in real terms, the sector faces a demographic shift with falling primary school pupil numbers, which alters funding dynamics at the local level.
    • Defence (£61 Billion): Maintained at approximately 2.2% of GDP, the defence budget covers the armed forces, operations, and capital procurement (such as the nuclear deterrent).
    • Public Order and Transport (£84 Billion Combined): The criminal justice system (police, courts, prisons) and national transport infrastructure share a smaller slice of the pie. These “unprotected” departments often face the tightest real-terms spending settlements when budgets are constrained by the demands of Health and Welfare.

    The constrained fiscal environment

    The spending breakdown reveals a highly constrained fiscal environment. The largest areas of expenditure—pensions, healthcare, and debt interest—are largely non-discretionary. They are driven by demographic realities, inflation, and global interest rates, rather than active policy choices.

    Consequently, any attempt to reduce total spending requires confronting these massive budgets, while any desire to increase spending on smaller departments (like Transport or Justice) requires finding significant new revenue or accepting a higher deficit.

  • Where Does the UK Tax Revenue Come From?

    Where Does the UK Tax Revenue Come From?

    UK Public Sector Receipts (Nov 2025 Forecast)

    TOTAL
    £1,232bn
    Click to Reset

    Total Revenue

    Forecast (2025/26) £1,232 Billion
    Cost Per Household £42,500

    Total forecasted receipts for the UK public sector, updated for the November 2025 OBR Outlook.

    💡
    OBR Key Insight
    Tax as a share of GDP is forecast to rise to a post-war high of 38.3% by 2030, driven largely by frozen personal tax thresholds.
    Source: OBR Economic and Fiscal Outlook, November 2025 (Tables 2.8, 3.1, 4.1).

    The United Kingdom government is projected to collect £1,232 billion in total public sector current receipts during the 2025-26 financial year, according to the Office for Budget Responsibility. This figure represents approximately 40.5% of national income, equivalent to £43,077 per household. Taxes comprise 90% of these receipts, with the remainder generated from interest on assets and the operating surpluses of public corporations.

    Income tax and national insurance contributions remain the primary engines of state revenue, collectively expected to raise approximately £530 billion. This concentration of revenue sources means that nearly 43 pence of every pound collected by the exchequer originates from levies on personal earnings. Within this category, income tax is forecast to raise £324.6 billion, while national insurance contributions are expected to provide £205.4 billion. The Office for Budget Responsibility notes that national insurance receipts will rise due to the recent increase in employer contribution rates and the lowering of the secondary threshold.

    Value added tax serves as the third largest contributor, with a forecast yield of £179.6 billion, representing 14.6% of all receipts. Corporate tax receipts are anticipated to contribute £108.4 billion, reflecting the continued impact of the 25% main rate. While these four major taxes account for two-thirds of total revenue, the treasury also relies on smaller levies such as business rates, council tax, and fuel duty to meet its spending requirements.

  • Who Pays for the State? A Breakdown of UK Tax Contribution

    Who Pays for the State? A Breakdown of UK Tax Contribution

    The UK government is forecast to raise approximately £1.13 trillion in revenue for the 2025/26 financial year. While the aggregate figure is well-publicized, the distribution of this burden – who pays, how much, and through which mechanisms – is often less understood.

    By analysing official data from HMRC and the Office for National Statistics (ONS), we can observe distinct, and often opposing, forces at work within the tax system.

    The “career prime” peak (age and gender)

    Tax contribution is deeply tied to our life stages. As the chart below illustrates, tax revenue follows a clear “hill” shape.

    Contribution is low when we are starting our careers, ramps up significantly in our 30s, and hits a peak between the ages of 45 and 54.

    This decade is typically the “career prime” for many workers—where experience, seniority, and hourly wages converge to produce the highest earnings. This single age bracket contributes roughly 30% of all income tax.

    Who Pays Income Tax? (By Age & Gender)

    Peak Tax Generation
    Age 45-54
    Contributes £96bn (30% of total)
    Gender Split
    63%
    37%
    Men pay nearly 2x more tax due to higher earners in top brackets.
    The “Retirement Drop”
    -68%
    Tax contribution falls sharply after age 65.
    Source: HMRC Survey of Personal Incomes (Table 3.2), projected for 2025/26.

    However, the chart also highlights two societal challenges:

    1. The Gender Gap: Men contribute nearly two-thirds of all income tax. This is not because tax rates are different based on gender, but because it reflects the wider economy: more men occupy higher-paying senior roles, and more women work part-time, often balancing careers with care responsibilities, keeping their total taxable income lower.
    2. The Retirement Cliff: As people leave the workforce and rely on pensions, their tax liability falls. In an aging society where people are living longer post-retirement, this creates significant pressure on the working-age population behind them.

    The heavy lifters (income groups)

    Who bears the burden? (Tax by Income Group)

    Breakdown of projected Income Tax liabilities for 2025/26.

    The Top 1%

    Annual Income Required > £192,000
    Share of Total Tax 29.1%
    Avg Tax Bill £215,000
    Population ~340,000 People

    Despite being a tiny fraction of the population, this group contributes nearly a third of all Income Tax revenue.

    Key Insight: The top 10% of earners (anyone earning over £60k) pay 60% of the entire nation's Income Tax bill.
    Source: HMRC Survey of Personal Incomes, Table 2.4 (Shares of total Income Tax liability).

    If the Age/Gender chart shows when we pay tax, the Income Group chart shows how much.

    The UK operates a "progressive" tax system. This is a deliberate political design meaning the more you earn, the higher percentage of your income you pay.

    The results of this design are that the UK tax base is incredibly top-heavy:

    • The Top 1%: This tiny group—about 340,000 people earning over £192,000 a year—contributes 29.1% of all Income Tax. To put that in perspective, the tax paid just by the top 1% is roughly equivalent to the entire budget of NHS England.
    • The Top 10%: If you combine the top two green bars, you find that those earning over roughly £60,000 (the top 10% of earners) pay 60% of the nation's entire Income Tax bill.

    Conversely, the "Bottom 50%" of earners contribute only about 10% of the total. This is largely due to the Personal Allowance, which allows everyone to earn their first £12,570 tax-free, protecting the lowest earners from Income Tax entirely.

    Direct and indirect taxation: The hidden counterbalance

    When we look exclusively at direct taxes - principally income tax - the data reveals a highly concentrated tax base. The system is designed to be progressive, meaning contributions rise disproportionately with earnings.

    However, focusing solely on income tax provides an incomplete picture. A different dynamic emerges when we analyse Indirect taxes - levies such as Value Added Tax (VAT), fuel duty, and duties on alcohol and tobacco.

    The "Hidden" Tax Bill (VAT & Duties)

    Breakdown of indirect taxes paid by household income group (Poorest to Richest).

    The Poorest 10%

    Avg. Indirect Tax Bill £2,800
    Effective Tax Rate ~22%

    While they pay less in cash terms, the poorest households lose the largest share of their income to VAT and duties because they spend nearly everything they earn.

    Source: ONS Effects of Taxes and Benefits on Household Income (Table 14).

    Unlike income tax, which targets earnings, these taxes target consumption. Because lower-income households tend to spend a larger proportion of their earnings on essentials and goods subject to VAT (saving less than high earners), the burden of these taxes falls differently.

    ONS data on The Effects of Taxes and Benefits shows an inverse relationship compared to Income Tax:

    • Cash Terms: High-income households pay more in absolute terms simply because they consume more.
    • Percentage Terms: Low-income households pay a significantly higher percentage of their disposable income in indirect taxes.

    For the poorest 10% of households, indirect taxes can account for roughly 22% of their disposable income. For the richest 10%, this figure drops to approximately 8-9%, as a larger portion of their money flows into savings, investments, or mortgages, which do not attract VAT.

    A complex balancing act

    The UK tax system is structurally top-heavy regarding income, relying on a small demographic of high-earning, working-age individuals to fund the bulk of public services.

    Yet, when expenditure is factored in, the system exerts a heavier proportional pressure on lower-income households through indirect taxation. Understanding both sides of this equation - the progressive nature of income tax and the regressive nature of consumption taxes - is essential for any informed discussion on fiscal responsibility and fairness.

  • Is the student loan threshold freeze ‘fair and reasonable’ or a ‘moral failure’?

    Is the student loan threshold freeze ‘fair and reasonable’ or a ‘moral failure’?

    Chancellor Rachel Reeves has defended the decision to freeze the salary threshold for Plan 2 student loan repayments at £29,385, despite accusations from consumer advocates that the move effectively treats student debt as a tax.

    Image by Tad Hanna from Pixabay

    In a nutshell

    • Threshold Freeze: Chancellor Rachel Reeves announced in the November Budget that the salary threshold for Plan 2 student loan repayments (for those who started university between 2012 and 2023) will be frozen at £29,385 for three years starting April 2027.
    • Fiscal Drag: By keeping the threshold static while wages generally rise with inflation, the government effectively increases the amount graduates pay back each month. This process is often referred to as “fiscal drag.”
    • “Fair and Reasonable”: Reeves defended the move as a way to align different repayment plans and balance the national budget, describing the measure as “proportionate.”
    • “Moral” Criticism: Personal finance expert Martin Lewis has heavily criticized the decision, arguing that it treats student loans like a tax and constitutes a “moral” failure, especially as it alters the terms of a contract young people signed years ago.
    • High Interest Rates: Plan 2 borrowers are particularly affected because their loans carry higher interest rates (currently up to 6.2%) compared to older or very recent plans, making it harder to reduce the total debt even while making regular payments.
    • Broader Context: The freeze sits alongside a wider government strategy to freeze income tax and National Insurance thresholds, a move aimed at stabilizing public finances without raising headline tax rates.

    In depth

    Chancellor Rachel Reeves has described the current student loan repayment system as “fair and reasonable” following intense criticism regarding the decision to freeze repayment thresholds for certain borrowers. Speaking to BBC Newsnight, the Chancellor argued that the measures announced in the November Budget were “proportionate” and necessary to balance the national accounts.

    Under the new Treasury policy, the salary level at which Plan 2 student loans must be repaid will be held at £29,385 for three years, beginning in April 2027. This plan applies specifically to students in England and Wales who commenced their studies between September 2012 and July 2023. By maintaining the threshold at this fixed level while nominal wages rise, the government utilizes “fiscal drag” to increase the total amount collected from graduates.

    The policy has met significant opposition from personal finance expert Martin Lewis, who argued that the Chancellor is treating student debt as a de facto tax. According to BBC News, Lewis stated that freezing the threshold was “not a moral thing” to do, noting that students were entering a contract they were not fully educated on. “It’s a contract that the government signed with young people,” Lewis told Newsnight, urging the Treasury to “please have a rethink.”

    Plan 2 borrowers currently pay 9 per cent of their earnings above the threshold. While the freeze does not alter the percentage, it ensures that a larger portion of a graduate’s salary is subject to the deduction as their pay increases with inflation. This group of borrowers is already subject to interest rates determined by the Retail Prices Index (RPI) plus up to 3 per cent, currently reaching as high as 6.2 per cent for high earners.

    Individual borrowers have expressed concerns regarding the transparency of the loans. Luke Pierre, a finance manager who graduated in 2019, told BBC Radio 4’s Money Box that he still owes “well over £50,000” despite six years of repayments. Pierre characterized the situation as a “mis-selling” to an entire generation, arguing that the high interest rates and the impact on mortgage applications contradicted the advice given to students when they were 17 or 18 years old.

    In contrast, Nick Hillman of the Higher Education Policy Institute suggested that concerns over the debt are often overstated. Hillman noted that Plan 2 loans include “brilliant features” such as a 30-year write-off period for any remaining balance, a protection not found in commercial lending. He emphasized that the highest interest rates only apply to those earning significantly over £50,000 per year.

    The threshold freeze coincides with the government’s decision to extend freezes on income tax and National Insurance thresholds. This broader fiscal strategy aims to increase tax receipts without raising headline rates, though critics argue it places a disproportionate burden on middle-income earners and recent graduates already grappling with high housing and energy costs.